Do you know the importance of thermography in detecting problems in building installations?
Anyone who has dealt with or is dealing with building installations (residential, commercial, industrial, etc.) knows how challenging it can be to detect leaks or electrical issues. To help you, we have prepared a comprehensive content on the subject. Read our article and discover:
- The importance of thermographic analysis in detecting problems in building installations
- What is thermography?
- Applications of thermographic analysis
Enjoy the reading!
What is the importance of thermographic analysis in detecting problems in building installations?
Detecting problems in building installations can be a major challenge, especially when it comes to intermittent electrical issues or leaks. These problems can completely or partially shut down a facility, causing discomfort, financial losses, and damage to the company's image. Fortunately, thermographic analysis is a technology capable of detecting these problems in a non-invasive and non-destructive way.
What is thermography?
Thermography, also known as thermal imaging, is a technology capable of capturing and visualizing infrared radiation emitted by objects and surfaces. With this technique, it is possible to compare the visual intensity of the inspected regions, which allows interpreting the causal conditions of the analyzed events.
In the color spectrum of thermography, warm colors, naturally purple to yellow represent the highest temperatures, while blue and transitions to purple represent the coldest temperatures. Green tones and transitions from yellow to green indicate intermediate colors. It is essential to note that the colors are always in reference to the focus point, and this scale, both in amplitude and intensity, can be pre-adjusted to facilitate the visualization of the point of interest more clearly and objectively.
What are the applications of thermographic analysis?
Thermography is a valuable tool for diagnosing electrical, hydraulic, and mechanical systems, as well as being a great tool for capturing research and preserving biomes and in the healthcare segment.
There are several applications of thermographic analysis. Among them, we can mention:
- Hydraulic systems;
- Electrical systems;
- Mechanical systems.
Hydraulic systems
In the technical area, thermographic analysis can easily detect atypical fluid flows, such as air, water, and gas in hydraulic systems. Even if the leaks are physically hidden, it is possible to identify them through the visual intensity of the inspected region. As examples of application, we can mention water leaks in slabs or walls caused by infiltrations or ruptures of connections in embedded pipes of wastewater or sewage.
In addition, thermographic analysis can detect gas leaks since the evaporation process generates cooling due to the pressure drop of the fluid container, as well as adiabatic losses suggesting damage to insulation in machine houses and air conditioning/heating ducts, among others.
Electrical systems
Another application is the use of thermographic analysis in detecting electrical problems, such as under-sizing, maintenance routine failures, and defective electrical components, as well as any part or subassembly in this universe that has an operational temperature incompatible with the expectation predicted in projects. This is undoubtedly the most widespread and extensive application in the maintenance market.
With the use of thermal imaging for inspections in electrical systems, it is possible to save resources and time, increase system availability, and carry out scheduled electrical shutdowns with great safety, predictability of consumable materials, team sizing, and action time prediction, thanks to the high precision provided by the method, optimizing and reducing the cost of interventions.
Mechanical systems
Considering that all mechanical systems, such as pumps, compressors, motors, and reducers, generate heat as a result of work and friction, thermography becomes a valuable resource for understanding and diagnosing possible distortions. These problems can be resolved in a programmed and organized way, avoiding unexpected and costly shutdowns caused by failures in coupling assemblies, bearings, and rollers. These failures can be caused by various factors, such as inaccuracies in assembly, poor material quality, inadequate lubrication, as well as deeper issues, such as problems in hiring and training personnel.
Thermographic application case study
Now let's examine three real examples of thermography application for diagnosing anomalies without the need for physical intervention by the maintenance team:
Leak detection
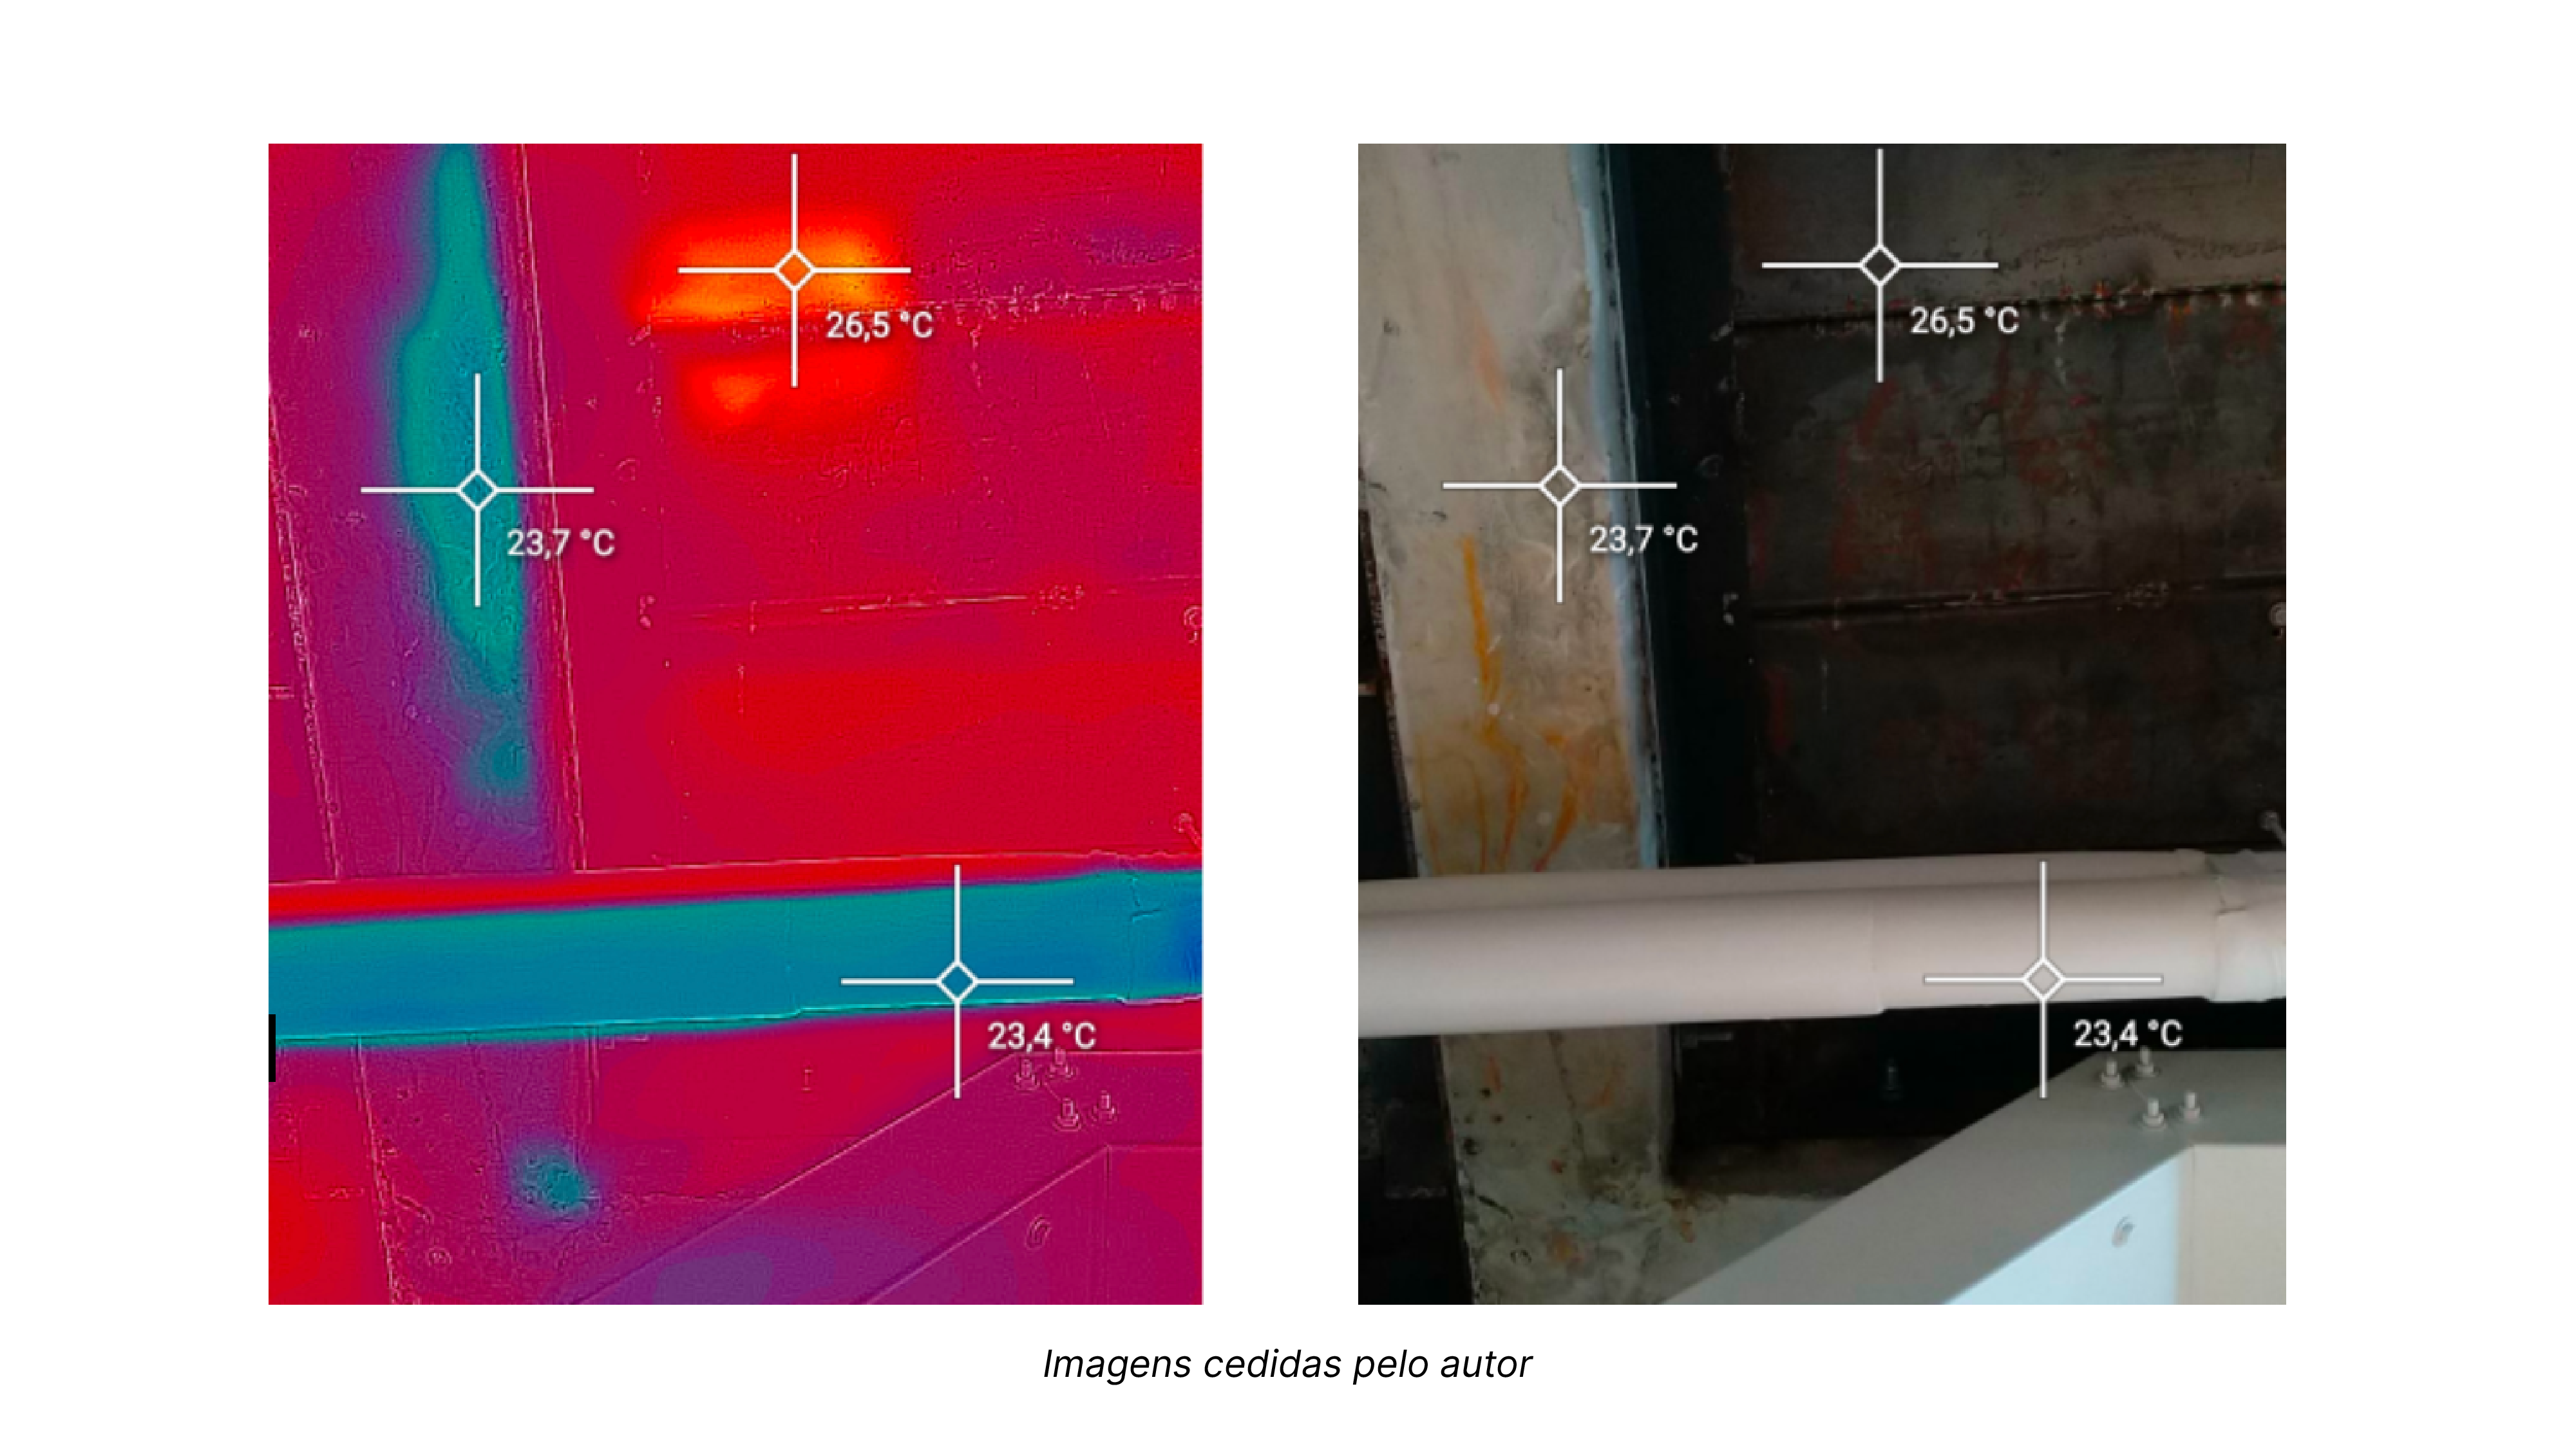
In the images below, the lighter areas highlight the wet spots on the slabs. This occurs because, in this case, under the effect of the climate-controlled environment, the water contained in the environment showed greater energy loss and, therefore, a temperature drop identified by the equipment showing wet areas. It is possible to observe that the piping itself presents this difference, for the same reason.
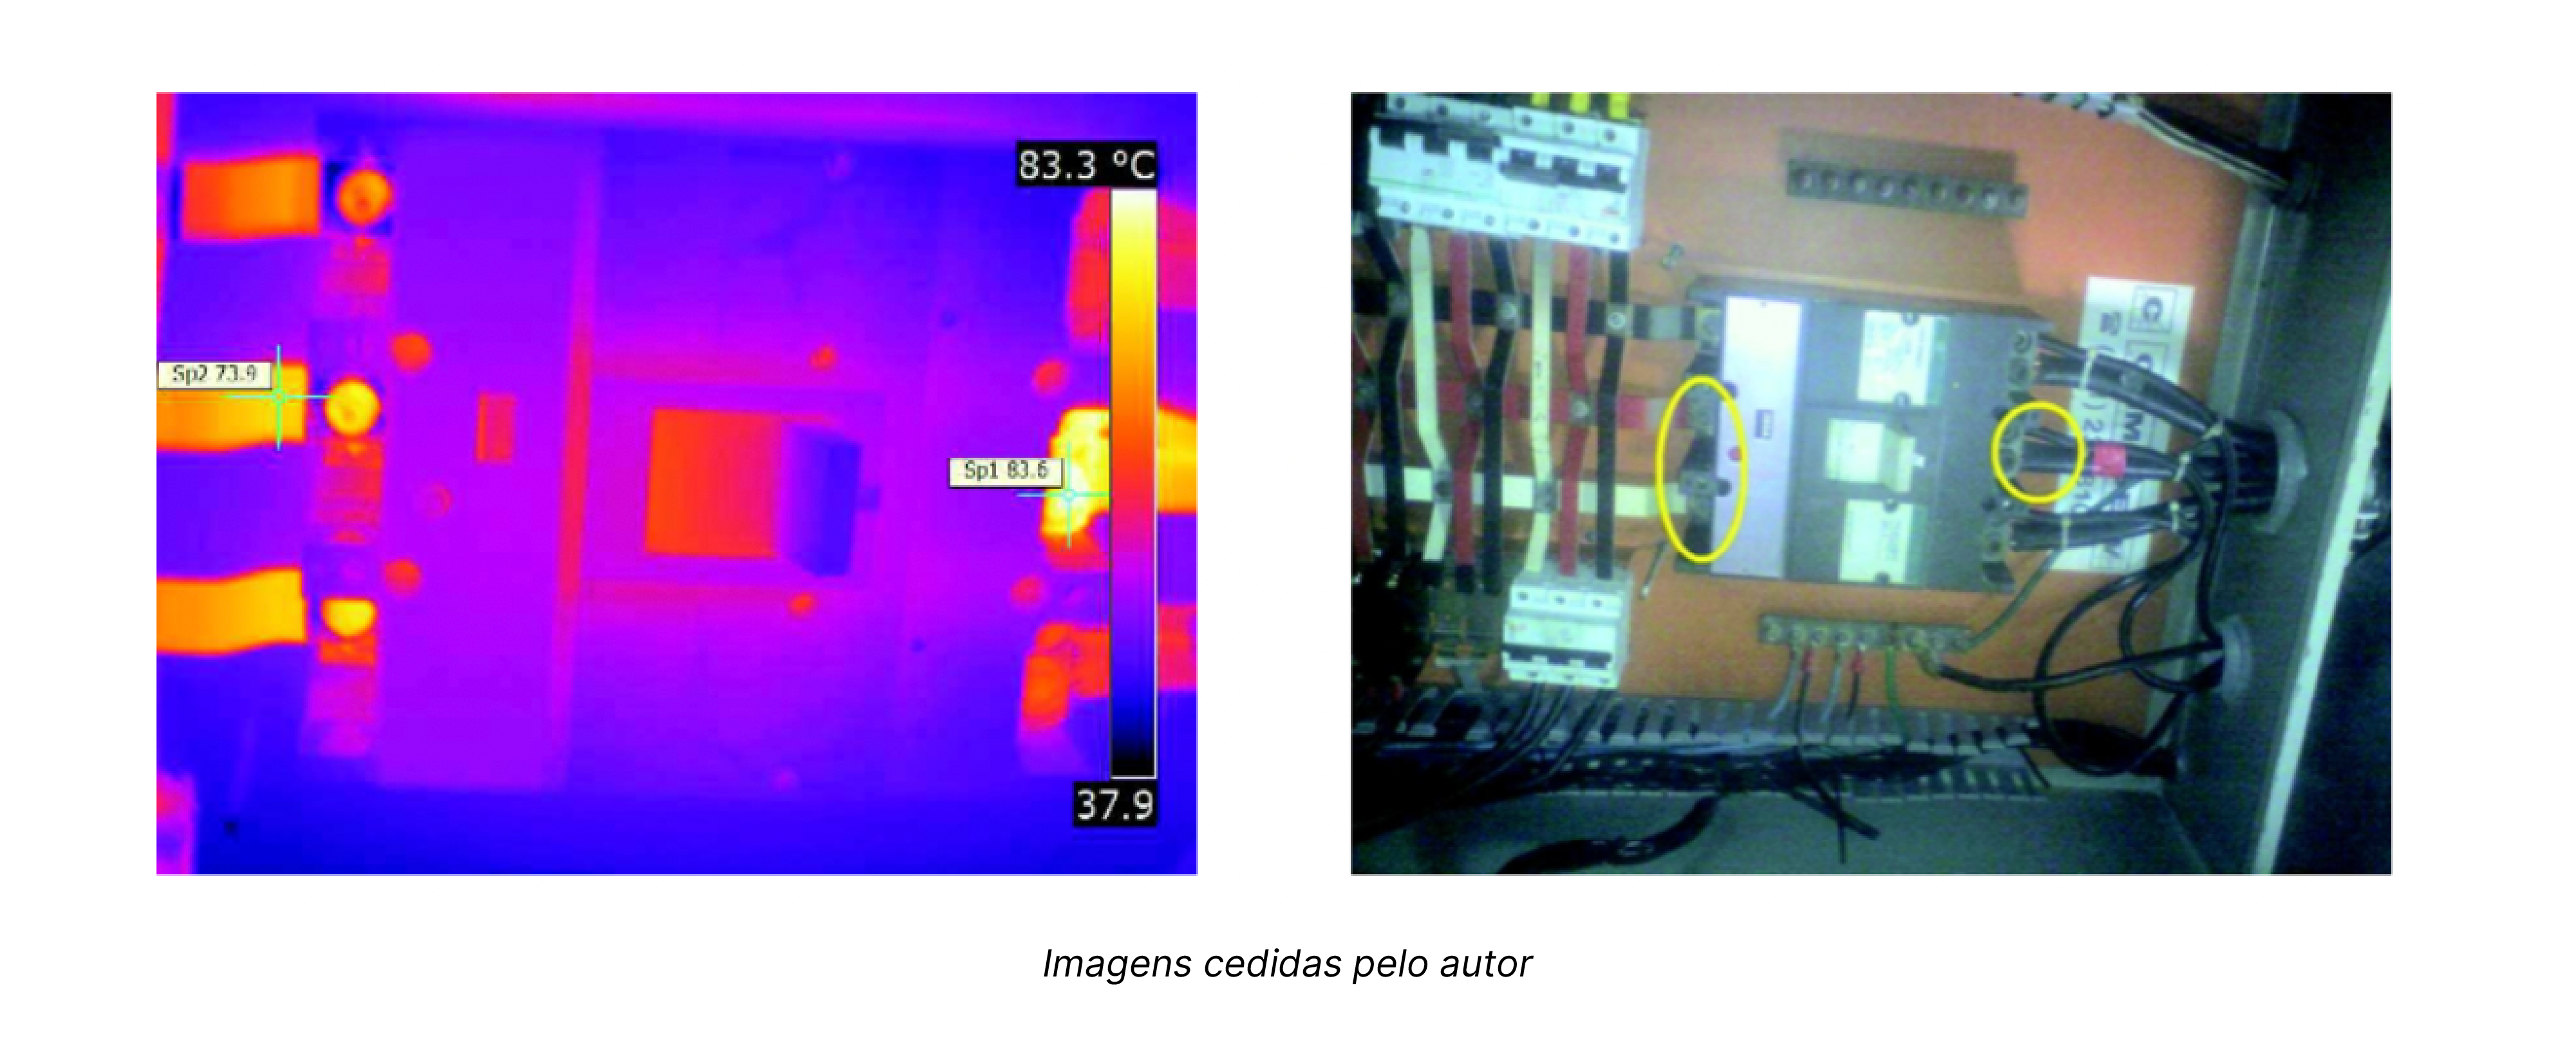
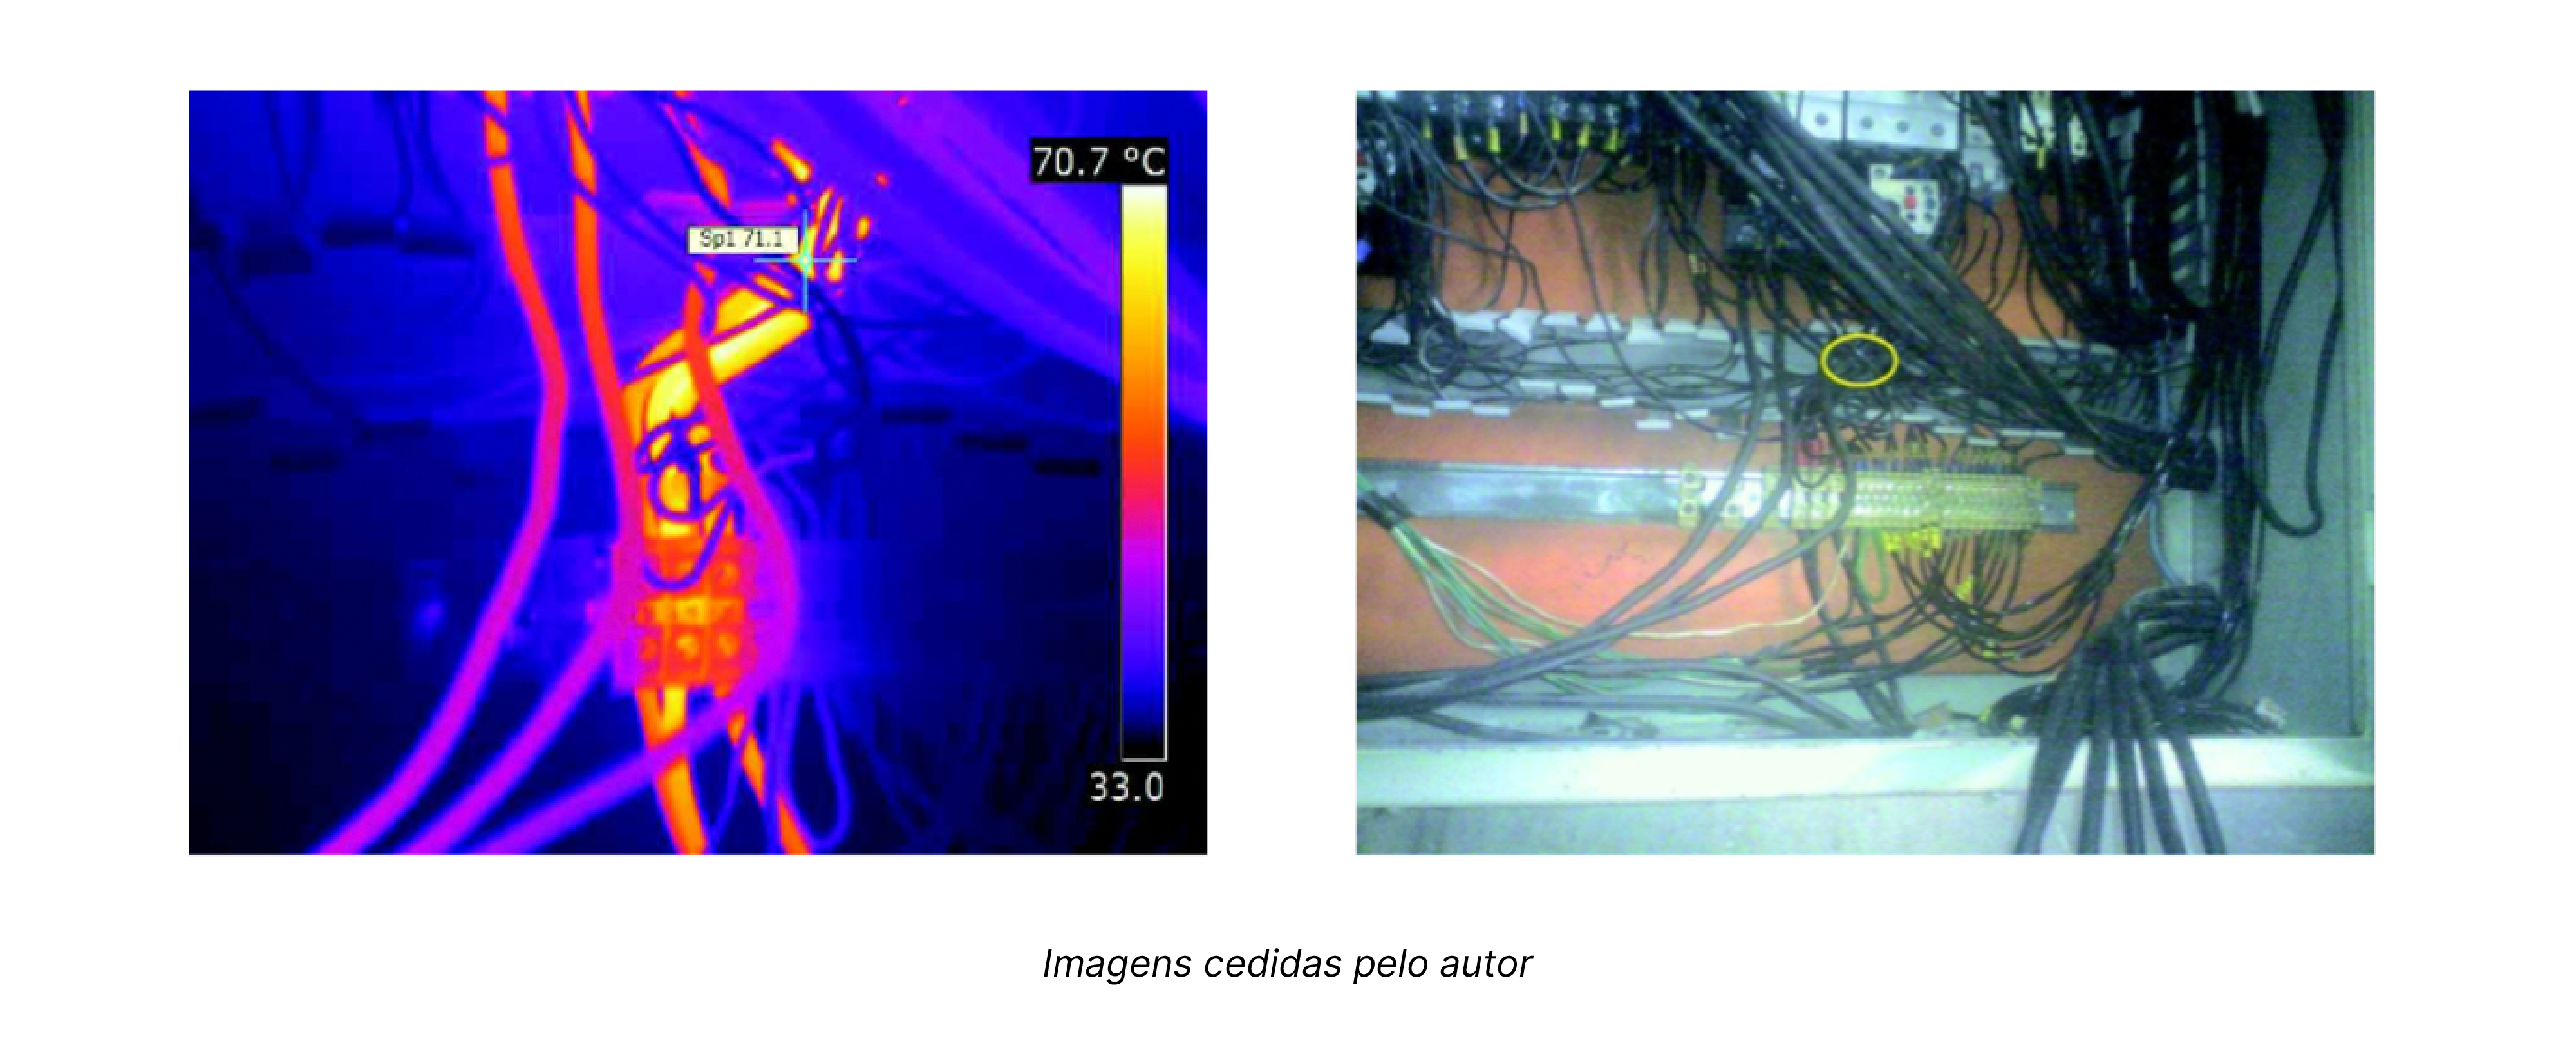
In the image, the presence of distortion originating from contacts is evident, suggesting the need to retighten the terminals. This highlights how, by interpreting the image correctly, it is possible to understand the problem with great precision.
In the following image, it is possible to observe the undersizing of the circuit, which results in unnecessary heating and increases the risk of circuit shutdown.
You can also read: 10 tips on how to reduce energy consumption in your company!
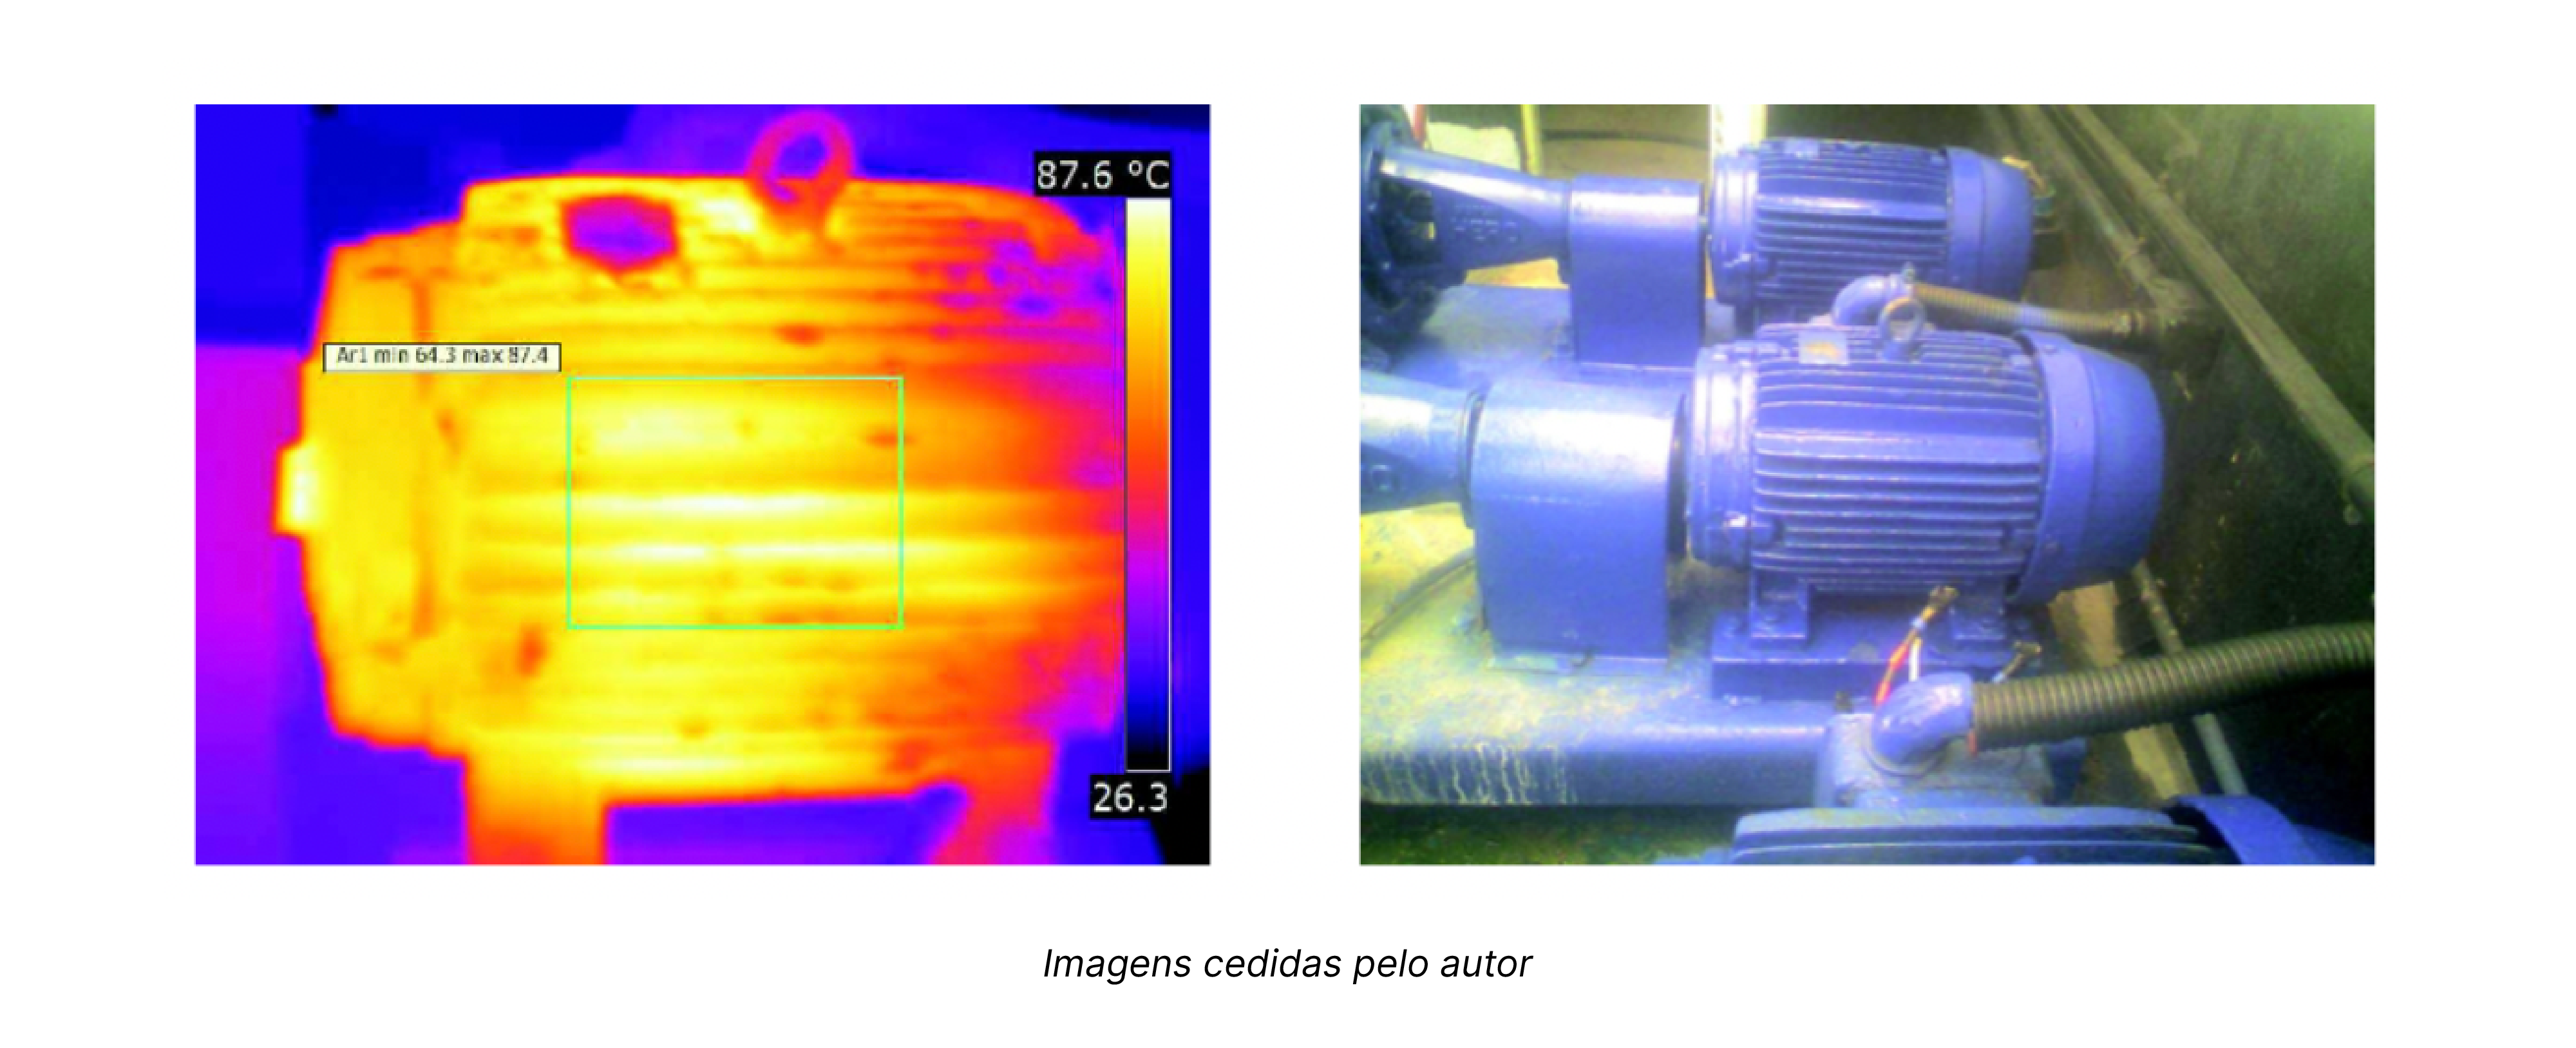
Mechanical Distortions
In the image, a possible compromise of the stator assembly insulation is evidenced by the heating point in the center of the equipment. This allows for quickly identifying mechanical issues and, subsequently, performing predictive maintenance, avoiding unplanned downtime.
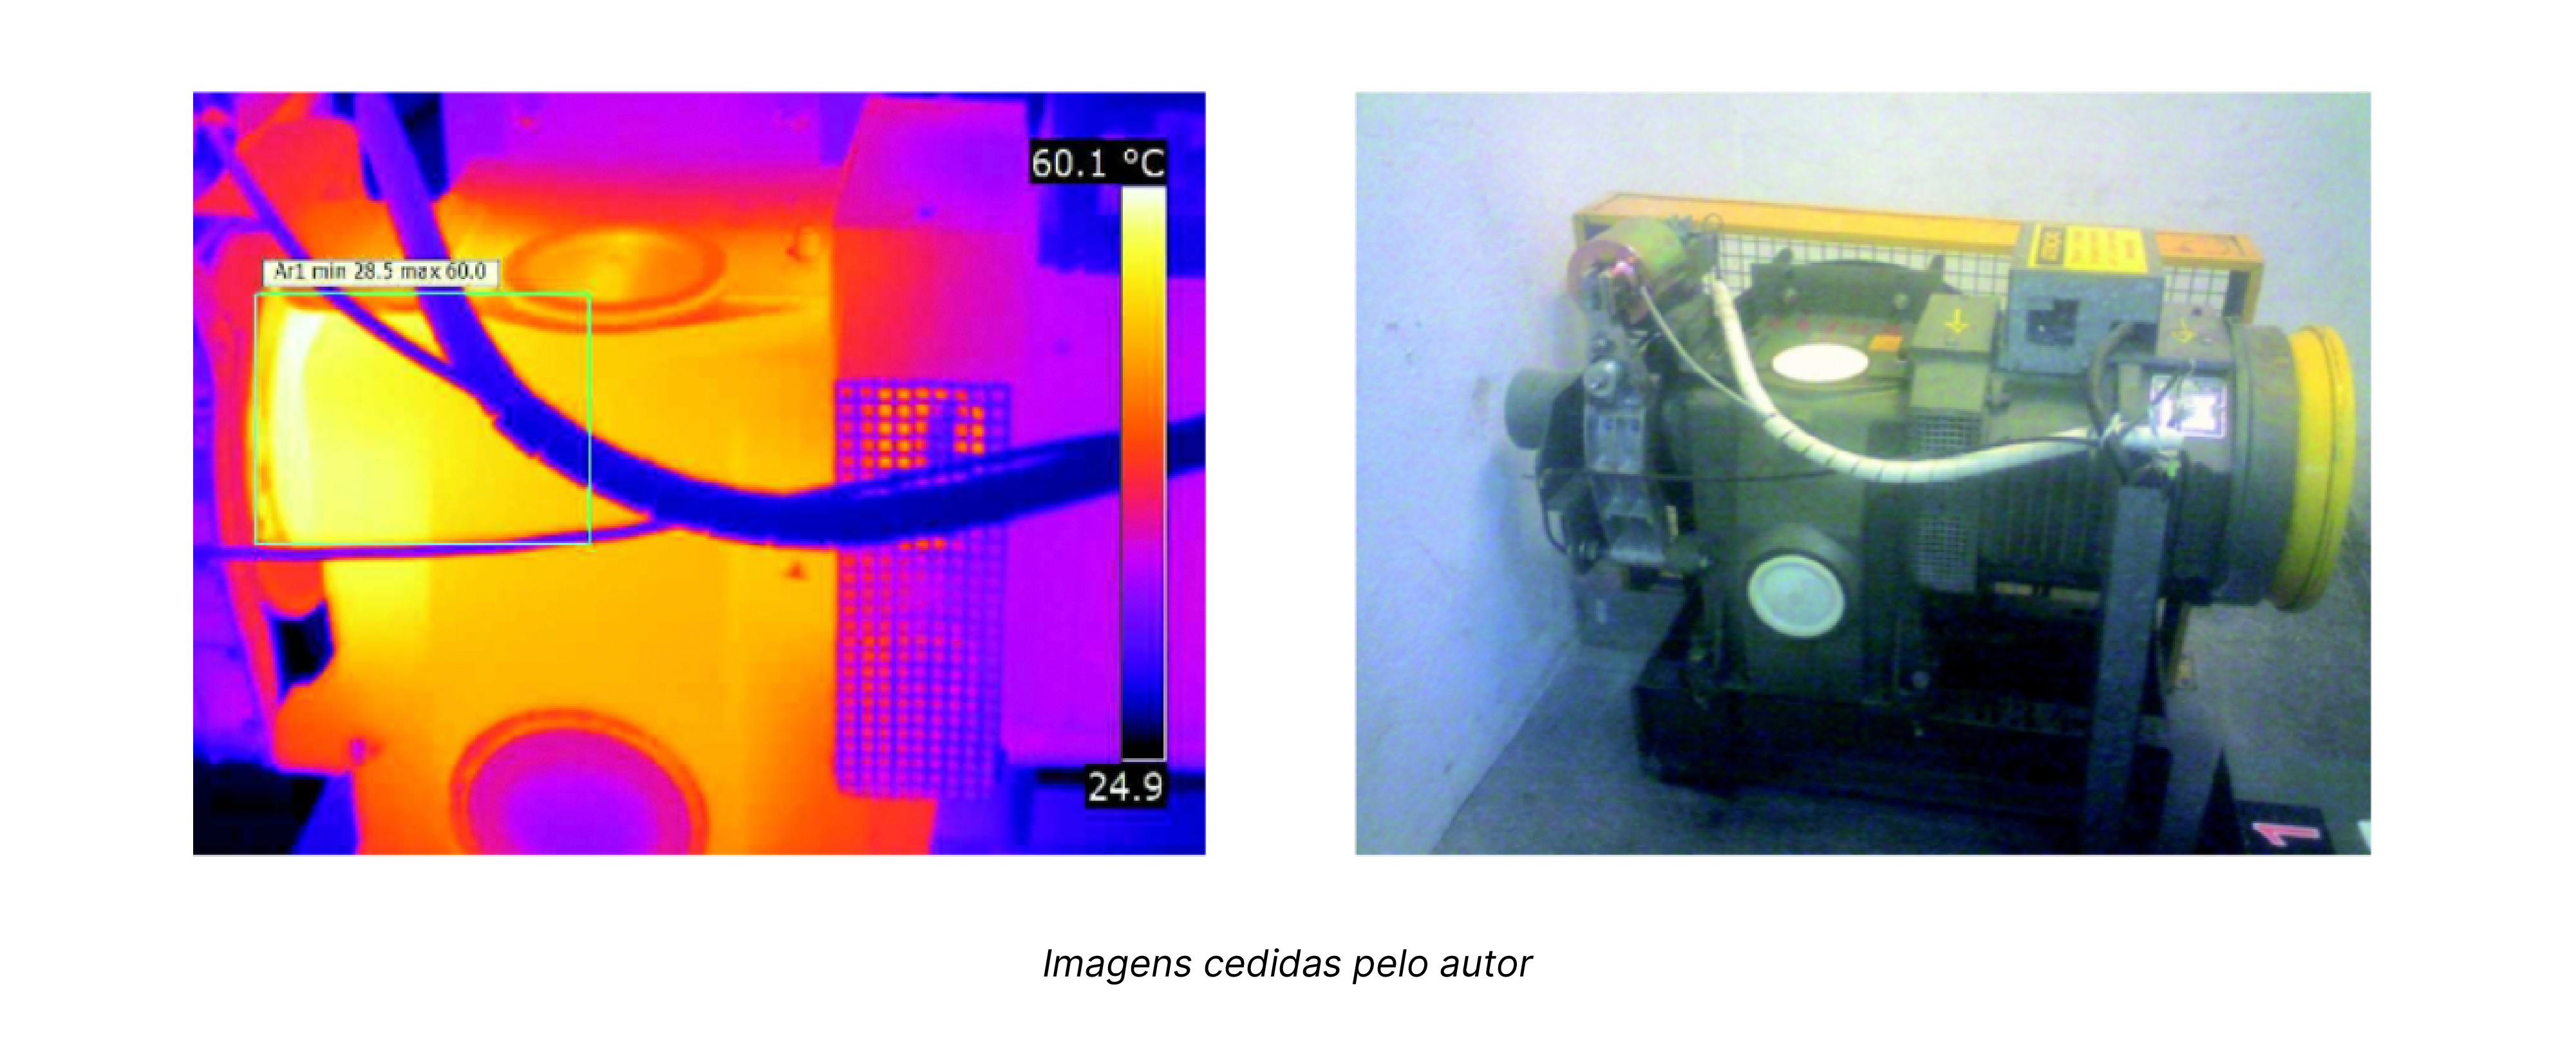
The equipment shown below is the gearbox of an elevator transmission assembly, and it displays a hot spot that possibly indicates heating in the bearing of the assembly. By accurately identifying the location of the heating, it is possible to perform a quick diagnosis and prevent any interruption in the elevator's operation.
There are several ways to perform thermographic analysis, from manual to real-time monitoring. Another way to carry out thermographic analysis is through continuous monitoring of the electrical panel's heat map. In this case, sensors are installed in the electrical panel and send real-time data to a monitoring platform. From this data, it is possible to detect anomalies and predict possible failures in electrical equipment, allowing for predictive maintenance to be performed before more severe problems have occurred.
In summary, regardless of the method of performing thermographic analysis, it is important to emphasize its importance in detecting problems in building installations, allowing anomalies to be identified in a non-invasive and non-destructive manner, saving time and resources, and increasing the efficiency of predictive maintenance.