It's no secret that the world is facing severe environmental problems and we are depleting our natural resources at an alarming rate. Greenhouse gas emissions grew by 53% from 1990 to 2019.
What are the 10 countries that generate the most greenhouse gas emissions on the planet?
According to the United Nations (UN), the world is made up of 193 countries, 10 of which are responsible for generating 68% of greenhouse gas emissions.Together they account for more than 50% of the world's population and 75% of the world's GDP.
Check the list below:
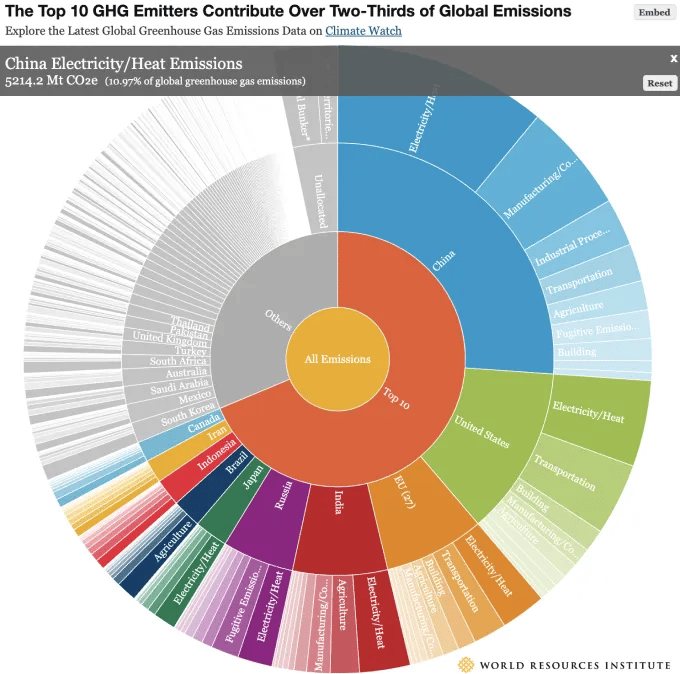
Source: Graphic by Johannes Friedrich. Data source: Preliminary global greenhouse gas emissions 2018 excluding land-use change and forestry (LUCF) from Climate Watch. The EU 27 is considered a country. *Bunker fuels include international aviation and shipping that are not included in country totals. Other territories include regions not covered by Climate Watch country data. See Climate Watch for country level land-use change and forestry and bunker fuel emissions.
On top, we found China with 26.1% of global greenhouse gas emissions:
-
China with 26.1%
-
United States with 12.67%
-
European Union with 7.52%
-
India with 7.08%.
-
Russia with 5.36%
-
Japan with 2.5%
-
Brazil with 2.19%
-
Indonesia with 2.03%
-
Iran with 1.74%
-
Canada with 1.52%
Even though they are not in the top 10 countries that produce the most emissions, Qatar and Australia have higher per capita emissions than most major emissions., with 40.52 tons ofCO2 per person and 23.10 tons of CO2 per person, respectively.
Which sector is the largest emitter of greenhouse gases?
The energy sector is the biggest emitter of greenhouse gases, but all sectors count in the fight against climate change.
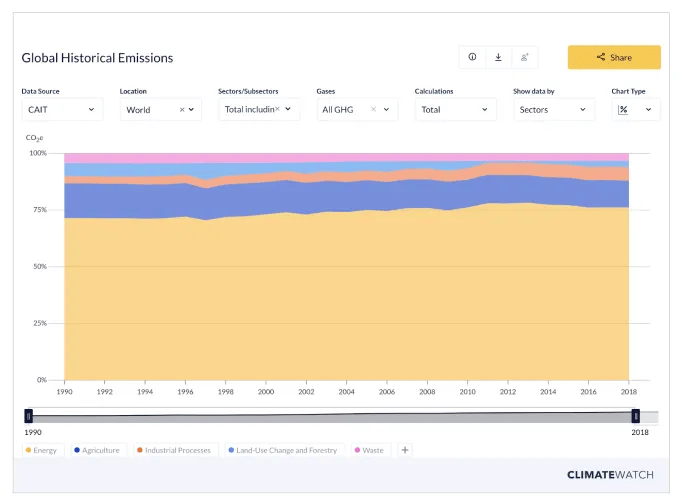
Since 1990 energy emissions have increased by 56%, however we have seen a slowdown since 2013, see the graph below.
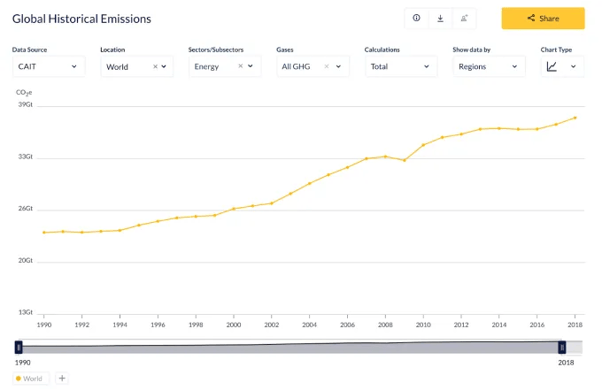
Source: Historical GHG Emissions
How to monitor the behavior of countries in environmental matters?
There are platforms in the world that bring visibility to the behavior of countries from an environmental perspective, one of these platforms is Climate Watch do WRI (world resource institute) que offers Comprehensive historical greenhouse gas emissions data for all countries.
Sources:
This Interactive Chart Shows Changes in the World's Top 10 Emitters - World Resouces Institute
Historical GHG Emissions - Climate Watch Data
Climate Watch Data